A lot of MSPs still gauge NOC KPIs and metrics the way they would five years ago: a handful of averages pulled from a PSA report once a month. NOC KPIs and metrics are quantitative benchmarks used by Network Operations Centers to measure network uptime, team responsiveness, and overall incident resolution efficiency. These specific indicators track performance health from initial alert detection through final mitigation. They give managed service providers objective data to prove service reliability and catch infrastructure bottlenecks before clients notice.
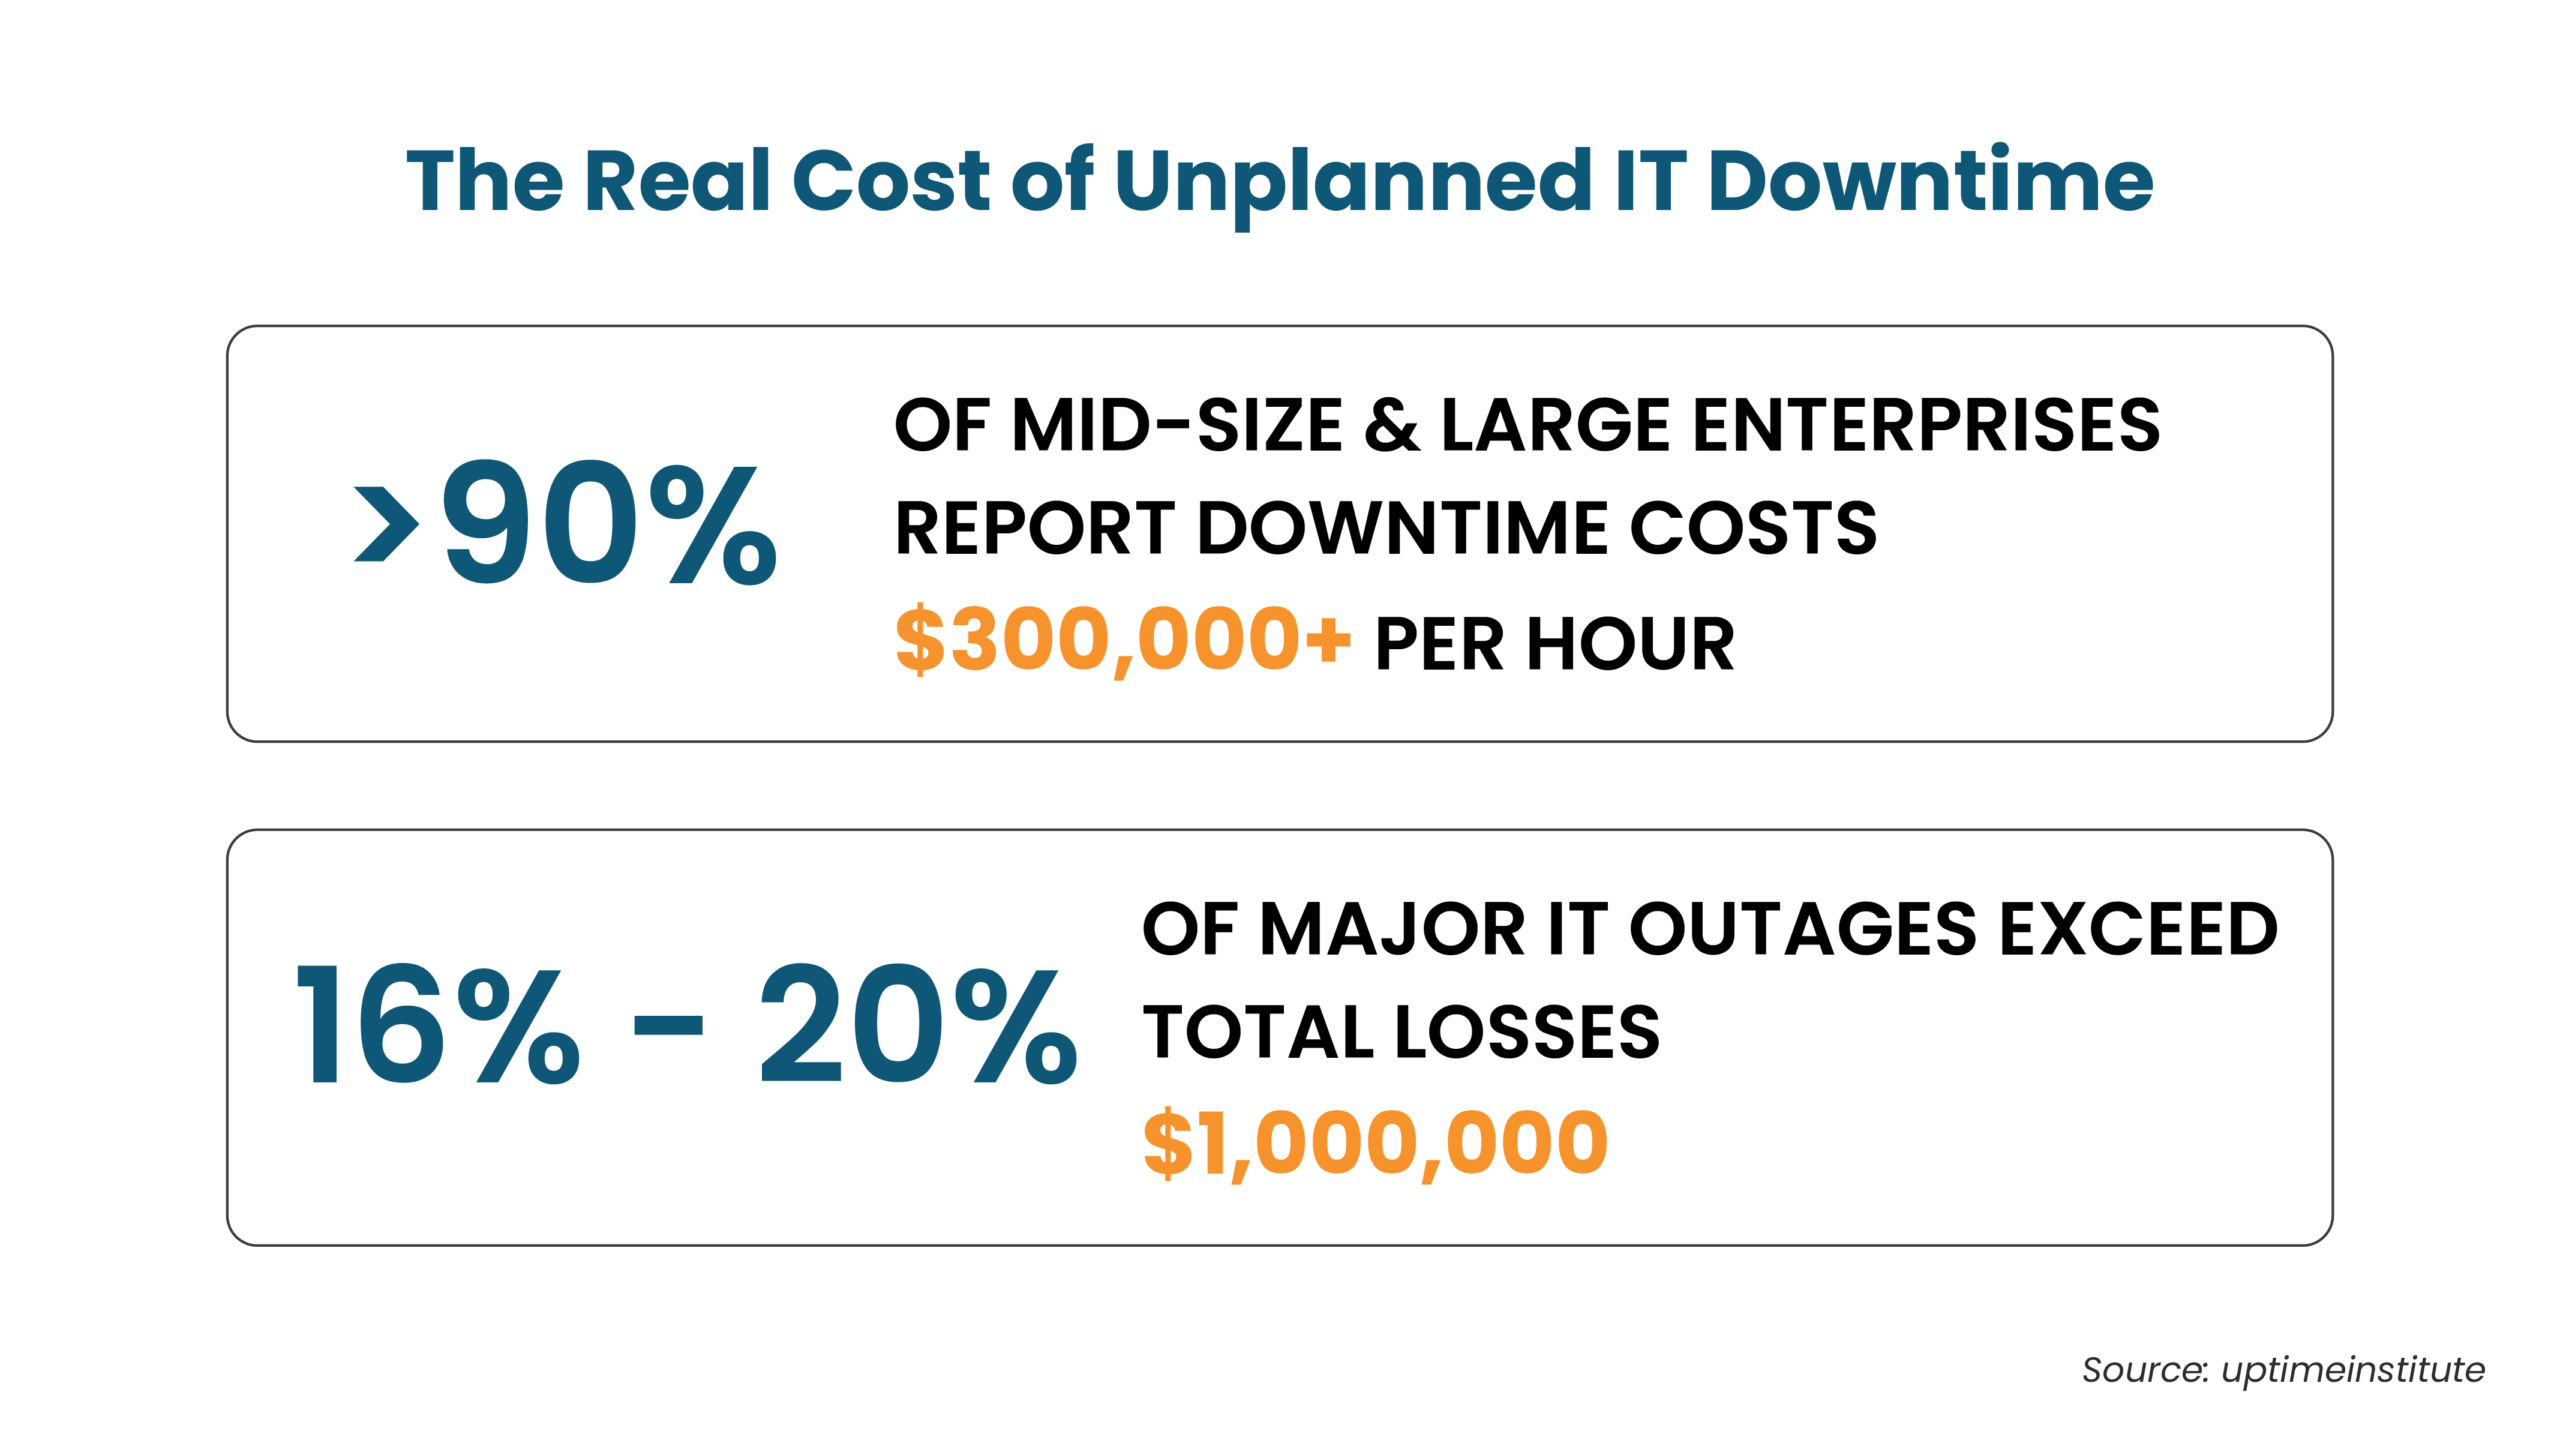
That approach worked when infrastructure was simpler and clients asked fewer questions. It does not hold up anymore. Outage costs keep climbing, and per Uptime Institute’s 2026 Outage Analysis, 1 in 5 major outages now costs more than a million dollars, with over half exceeding six figures. Customers footing the bill for 24/7 coverage want real evidence the stack works, not a casual assurance that things are fine.
Inside this breakdown are the 13 NOC metrics that separate high-performing monitoring teams from providers relying on plain luck. For each one, you get the formula, a good target, and a real benchmark where one exists. You will also find a measurement framework, a cadence for checking each metric, a dashboard-build framework, and how NOC KPIs differ from helpdesk KPIs.
What NOC KPIs and Metrics Track
A network operations center exists to catch problems before end users notice them. NOC KPIs and metrics, also called network operations center KPIs, measure exactly that: how fast a threat or fault gets detected, how fast someone acknowledges it, and how fast it gets resolved inside the promised service window.
That is a different job from a helpdesk, which mostly reacts to what users report after the fact. If you are unclear on where NOC responsibilities start and end, a breakdown of what a network operations center does helps understand the engineer roles, shift structures, and escalation tiers behind the numbers below.
Track these numbers for a significant amount of time to see a pattern showing up: teams that report NOC KPIs consistently catch drift in their own processes before a client ever has to ask about it. It helps that accountability loop, more than any single benchmark, and eventually that is what earns a renewal conversation instead of a competitive rebid.
The 13 NOC KPIs and Metrics Every MSP Should Track
Every solid set of MSP KPI benchmarks relies on these 13 metrics. Split them into three buckets: response speed, commitment reliability, and shift efficiency. The sections below give you actionable NOC KPI examples with working formulas; ones you can plug your own numbers into immediately.
Treating these benchmarks as living targets allows leadership to spot operational bottlenecks before they impact client SLAs. Once your baseline is established, reviewing these numbers weekly will reveal whether performance drops stem from process gaps or alert fatigue.
Incident Response KPIs
Mean Time to Detect (MTTD)
Mean Time to Detect (MTTD) is the gap between when a fault happens and when your monitoring stack catches it. Formula:

Under 5 minutes is a reasonable bar for anything tagged critical. When a team misses that threshold regularly, tight alert tuning or missing monitoring agents are almost always to blame.
Mean Time to Acknowledge (MTTA)
Mean Time to Acknowledge (MTTA) measures the exact delay between an alarm firing and a tech grabbing the ticket. Formula:

Enterprise NOC teams typically hold P1 acknowledgment under 5 minutes and P2 under 15. When MTTA creeps up, look at alert fatigue first, since engineers start skimming notifications once the volume gets unmanageable, and that habit shows up in the numbers before it shows up in a staffing request.
Mean Time to Resolve (MTTR)
Mean Time to Resolve (MTTR) is the average stretch from acknowledgment to a confirmed fix. Formula:

Four hours or under is the working MTTR benchmark for P1 incidents in enterprise SLAs. MetricNet’s benchmarking data published through HDI puts the blended average across all priorities at 8.85 business hours, which is why blending priorities into one number hides more than it shows.
P1 Incident Response Time
P1 Incident Response Time is narrower than acknowledgment: the clock between a Priority 1 alert firing and the first real action taken against it. Formula:

Fifteen minutes is what most managed service contracts write into their SLA for business-critical issues. Slower than that, and the monitoring promise stops matching the response promise.
First Call Resolution Rate (FCR)
First Call Resolution Rate (FCR) is the share of tickets closed on the first interaction, no callback or escalation needed. Formula:

SQM Group’s own industry benchmarking research puts the aggregate FCR benchmark at 70%, and top-performing teams push past 80. If your NOC’s FCR falls significantly below this target, Tier 1 technicians are likely escalating routine tickets that better internal documentation would allow them to resolve.
Ticket Reopen Rate
Ticket Reopen Rate catches closed tickets that come back because the fix did not hold. Formula:

Keep it under 5%. Watch this number over documentation quality: a creeping reopen rate usually means engineers are closing tickets to hit a resolution-time target rather than confirming root cause first.
Reliability and Compliance KPIs
SLA Compliance
SLA Compliance Rate is the percentage of incidents resolved inside the timeframe your contract promises. The sla compliance rate formula is:

Ninety-five percent is the floor most MSPs treat as acceptable, with 98% or higher expected on premium tiers. It is also the number most likely to show up in a client’s quarterly business review, so reconcile it against your ticketing system before you report it, not after the client already has.
System Uptime and Availability
System Uptime and Availability is how much of a billing cycle your monitored stack stayed live. Formula:

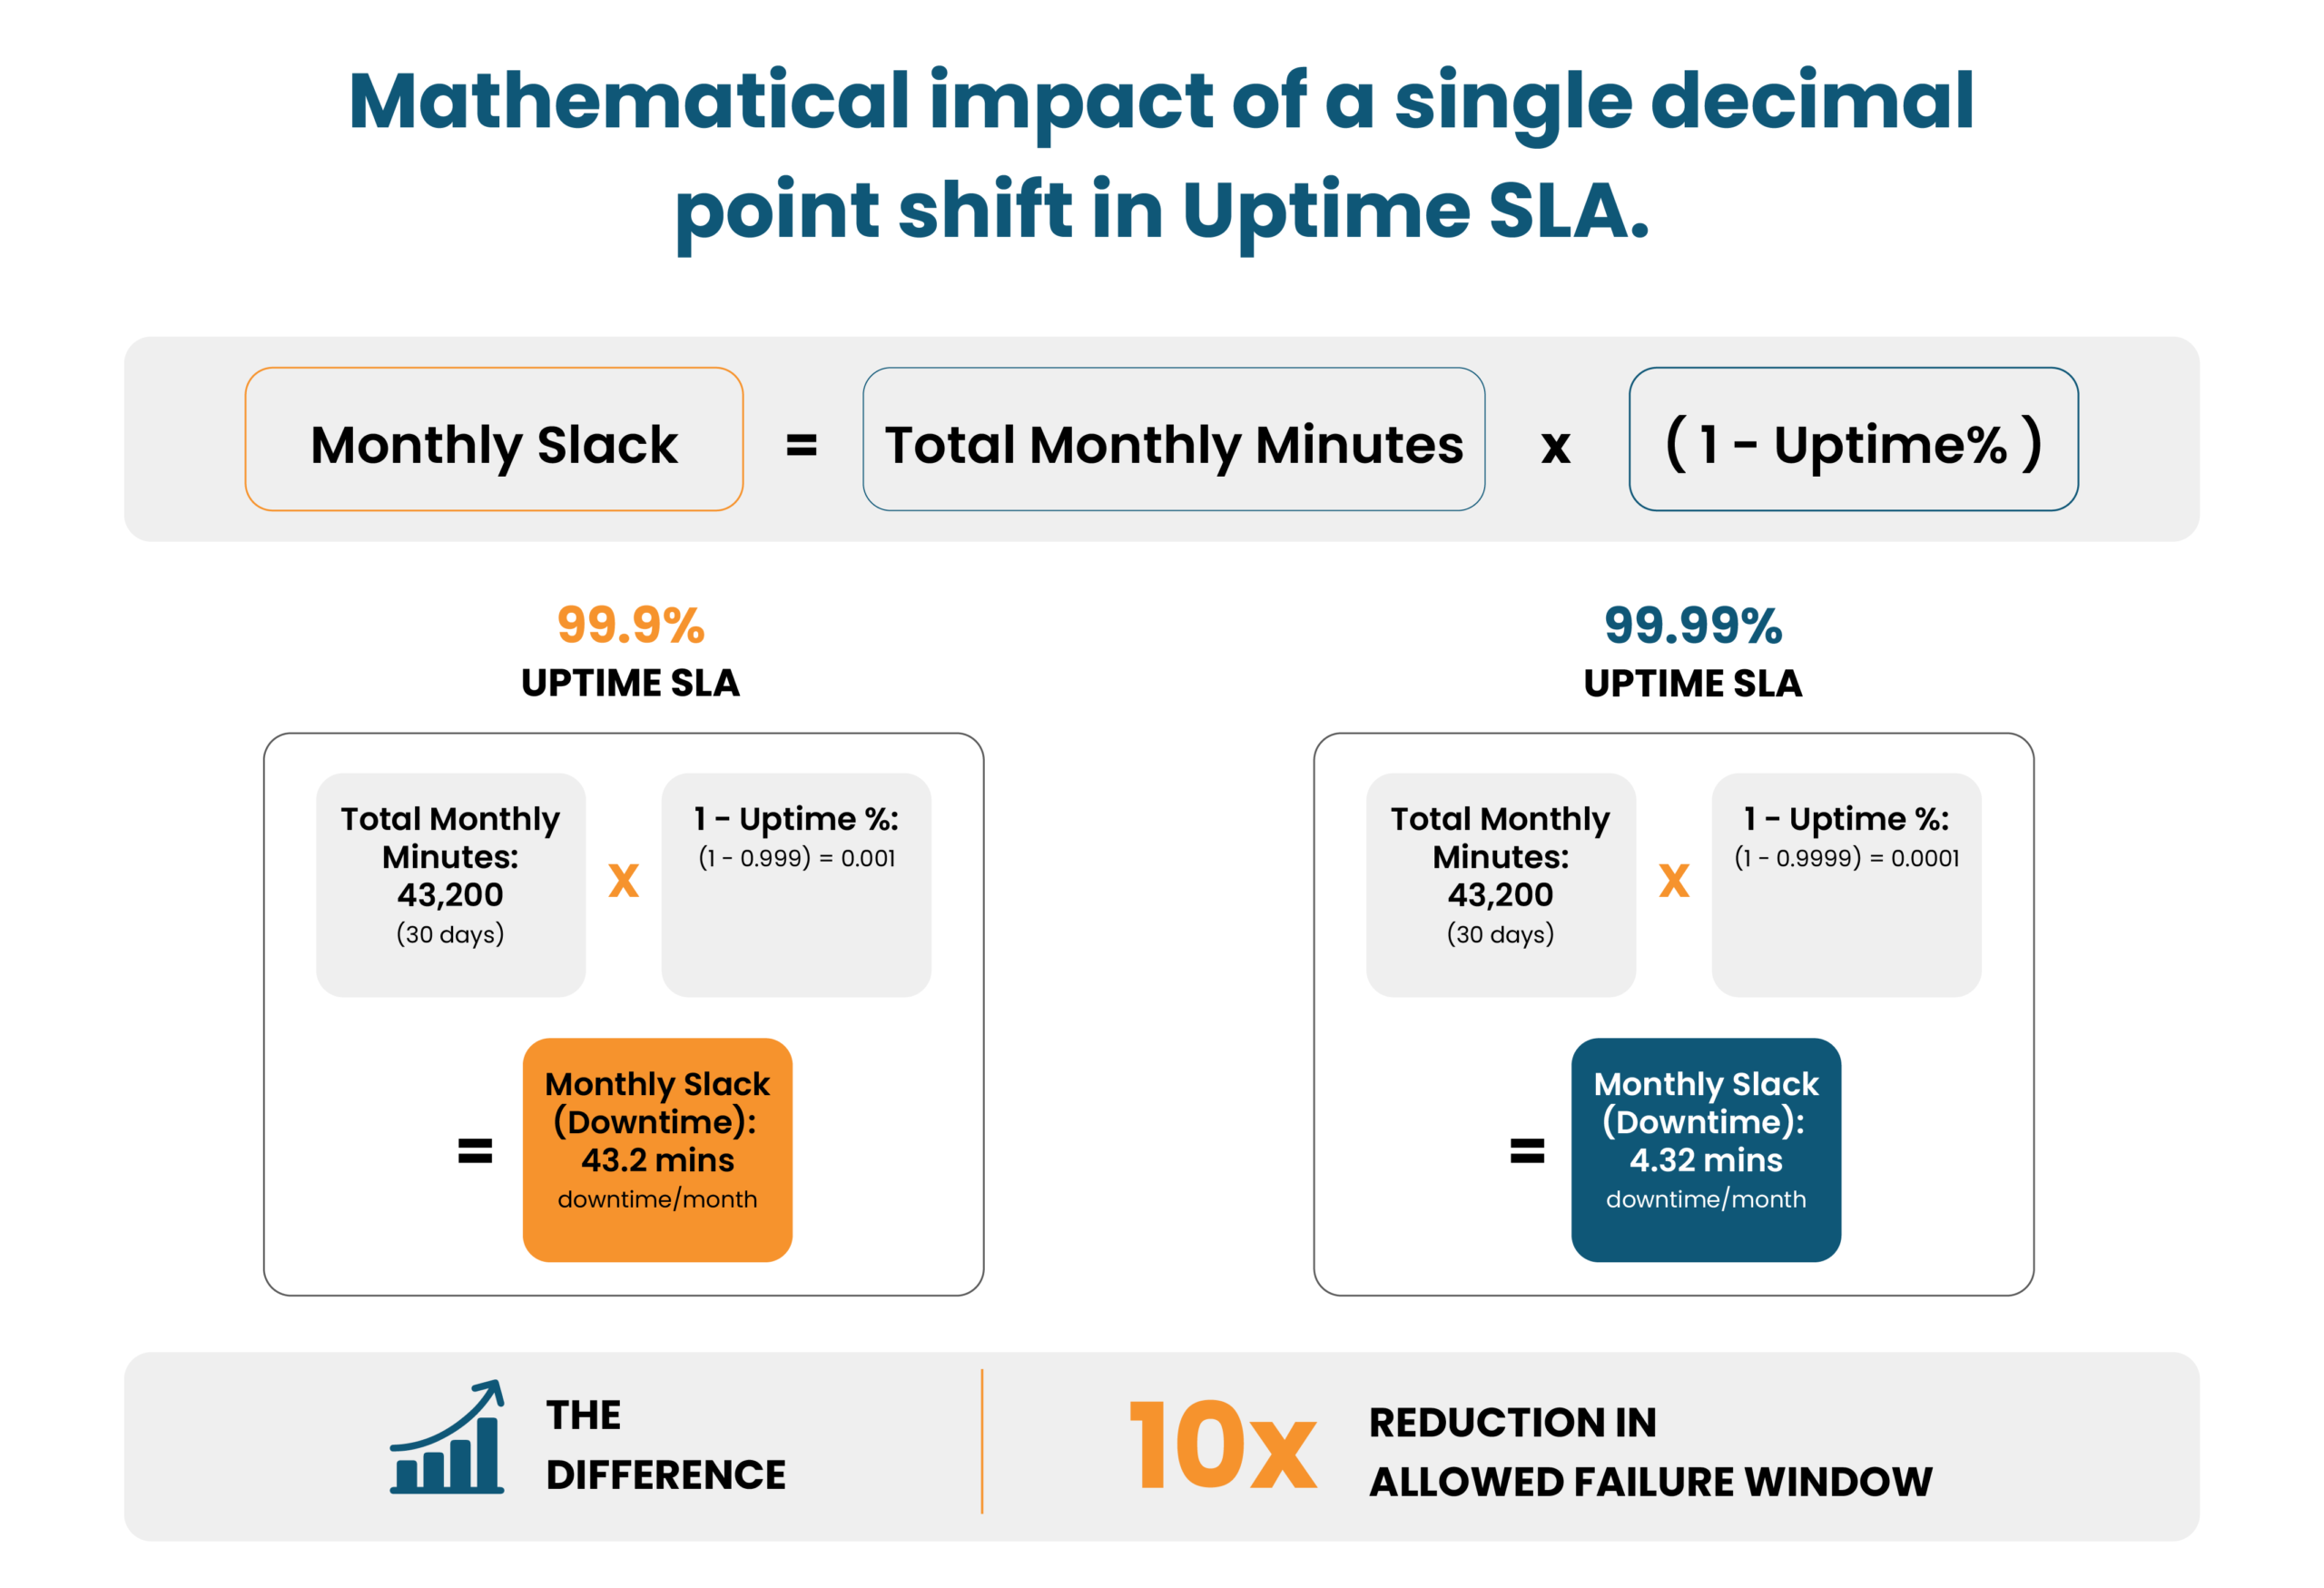
Most contracts promise 99.9%, about 43 minutes of slack a month; production workloads deserve the tighter 99.99% bar, under 5 minutes. That gap matters, since Uptime Institute research confirms that 20% of major outages now run past seven figures in direct financial loss.
Alert-to-Incident Ratio
Alert-to-Incident Ratio evaluates overall monitoring noise by measuring raw alarm volume against confirmed, actionable tickets. Formula:

Aim for a 10:1 ratio or lower to prove your threshold tuning works. Higher ratios force Tier 1 engineers to filter out garbage signals all day, which directly triggers analyst burnout and overlooked P1 notifications.
Escalation Rate
Escalation Rate is the share of tickets that move past Tier 1 before resolution. Formula:

Keep it under 15%. A rising number is not automatically bad, it can mean Tier 1 is triaging correctly rather than forcing fixes it cannot make. Pair it with reopen rate to know which story you are looking at.
Efficiency KPIs
False Positive Rate
False Positive Rate is the share of alerts that fire with nothing wrong underneath them. Formula:

Under 10% is reasonable for a mature setup. This one is worth fixing early, since a high false positive rate burns out NOC engineers faster than almost anything else on this list, and tightening thresholds usually keeps it in check.
Alert Volume
Alert Volume per Engineer is exactly what it sounds like. Formula:

There is no universal target here, partly because NOC KPI benchmarks by company size vary so much. A five-person NOC covering three clients will show different numbers than a 40-person team covering fifty. What matters is the trend. If the same two engineers absorb most of the load every shift, that is a staffing gap hiding behind a monitoring dashboard.
Customer Satisfaction (CSAT)
Customer Satisfaction (CSAT) captures how clients rate the support experience, usually via a short post-interaction survey. Formula:

Ninety percent is the bar most MSPs hold. CSAT does not always move with resolution speed either, since clients weigh communication just as heavily as ticket speed.
How to Measure NOC Performance, Category by Category
A quick reference for turning the KPIs above into daily action:
| Category | What to Measure | Tool Used | Good vs. Bad Number |
| Detection & Response | MTTD, MTTA | Monitoring platform, alerting console | Good: both under 5 min. Bad: either past 15 min. |
| Resolution | MTTR, P1 response time | PSA ticketing system | Good: P1 MTTR under 4 hrs. Bad: P1 MTTR over 8 hrs. |
| Reliability | SLA %, uptime % | PSA and uptime reports | Good: 95%+ SLA, 99.9%+ uptime. Bad: sub-90%. |
| Alert Quality | Alert ratio, false positives | SIEM console | Good: 10:1, sub-10%. Bad: 25:1+. |
| Client Experience | CSAT, ticket reopen rate | Survey tool, PSA | Good: CSAT 90%+, reopen rate under 5%. Bad: CSAT below 75%. |
When numbers keep missing the good column despite process fixes, that is usually a tooling ceiling. It is worth evaluating a switch in NOC providers before patching around it for another quarter.
How Often Should You Check NOC KPIs?
Tracking operational health requires rhythm because different metrics drift at different speeds. Reviewing critical indicators daily, weekly, monthly, and quarterly keeps managed service providers ahead of silent failures rather than playing catch-up after an SLA breach.
- Daily: MTTA and P1 response time, since a slip here on one shift often flags a staffing gap needing same-day action.
- Daily: open P1/P2 incident count, to catch anything sitting unresolved before it breaches SLA.
- Weekly: alert-to-incident ratio and false positive rate, since alert-tuning issues compound fast if left for a month.
- Weekly: escalation rate by engineer, to spot coaching needs before they show up in the client report.
- Monthly: SLA compliance rate and MTTR by priority tier, the numbers that go into the client’s monthly report.
- Monthly: ticket reopen rate, reviewed alongside resolution notes to catch root-cause shortcuts.
- Quarterly: uptime and availability trend against contract targets, evident in the client’s overall risk profile.
- Quarterly: CSAT trend alongside alert volume per engineer, catching burnout risk before it turns into attrition.
How To Build a NOC KPI Dashboard Clients Trust?.
Plenty of tools promise a real-time NOC KPI dashboard. The framework behind it matters more than the tool itself: clients trust numbers that match what they lived through, not a polished layout. Focus on actionable metrics over screen clutter by surfacing P1 response times and resolution trends front and center. Clear targets paired with honest operational context turn standard reporting into a strategic trust-builder.
- Start from a single system of record. A dashboard sourced from two disconnected systems, PSA on one side and monitoring logs on the other, is where credibility problems start, so reconcile them before anything goes on screen. Pulling this straight from your RMM alerting thresholds keeps that source of truth in one place.
- Segment every metric by priority tier. A blended MTTR hides P1 performance behind faster P3 numbers, and clients notice the gap eventually.
- Set thresholds, not just numbers. Show the target next to the actual figure so a client can see 92% SLA compliance against a 95% commitment without needing an explanation.
- Automate the daily refresh. A dashboard updated manually once a week is an inevitable bottleneck away from becoming a static report again.
- Add a short narrative to each report. A number without context, like a single major outage that skews MTTR, invites more questions than it answers.
Skip rebuilding this from scratch. Copy the metric grid above into your PSA’s reporting module, rename the tool column, done, so that’s your NOC KPI template.
One more thing for 2026 planning. Agentic AI NOC Monitoring isn’t a pilot anymore at most MSPs running it. It’s on the floor, doing first-pass triage on low-severity alerts and writing the root-cause note before anyone touches the ticket. The KPIs don’t move. What moves is the thing hitting them, used to be a person every time, now sometimes it’s not.
Run a quick check on all of this before it goes anywhere near a client:
- The date range on the dashboard matches what is in your PSA, not a rounded estimate someone typed in manually.
- Every red or yellow flag has a one-line explanation attached to it, not just a color.
- P1 numbers are shown on their own, never folded into the overall average.
Not every MSP wants to build this in-house. If yours would rather hand it off, the monitoring, alerting, and reporting scope is covered under NOC services built for MSPs.
Stop Guessing Your NOC Performance
Benchmark your incident response times, MTTR, and SLA compliance against top-performing 2026 MSP standards in under 15 minutes.
NOC KPIs and Metrics Versus Helpdesk KPIs: What’s the Difference?
NOC KPIs and helpdesk KPIs share an MSP stack but not a job description. A NOC can hit every target above while a helpdesk backlog piles up untouched, so keep the two on separate reports. Our helpdesk KPI benchmarks piece covers the ticketing side in more detail.
| Dimension | NOC KPIs | Helpdesk KPIs |
| What it tracks | Infrastructure the team watches proactively: servers, network gear, endpoints, cloud resources | Requests a person submits directly, after something already went wrong for them |
| Trigger | An alert fired by a monitoring tool | A ticket opened by an end user |
| Core metrics | MTTD, MTTA, MTTR, SLA % | First response, backlog, CSAT |
| Staffing | NOC shift rotations | Tier 1 / Tier 2 helpdesk |