This blog is regarding generating an audit report of the day-to-day bandwidth and other applications usage from FortiAnalyzer generated from FortiGate firewall.
What is FortiAnalyzer?
FortiAnalyzer is a powerful log management, analytics, and reporting platform that provides organizations with a single console to manage, automate, orchestrate and respond, enabling simplified security operations, proactive identification and remediation of risks, and complete visibility of the entire attack landscape.
For generating report from Analyzer, we need to perform the below steps.
- First, login to Analyzer.
- After logging in, you will see a dashboard which includes the below options.

- Once you can see the dashboard, just click on the Report.

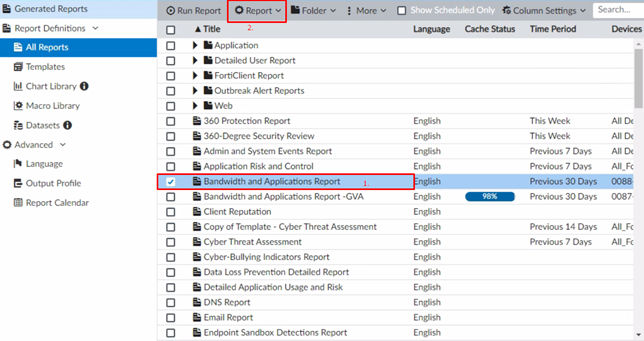
- After clicking on the reports, you will see Reports bars/options below.

Here, for now, I am only showing you how to generate the bandwidth and application Report.
Note: By default, this Template is available in Analyzer, you can create your own custom template as per the requirement.
- Click on the bandwidth and application report > Report > Edit. As shown below.
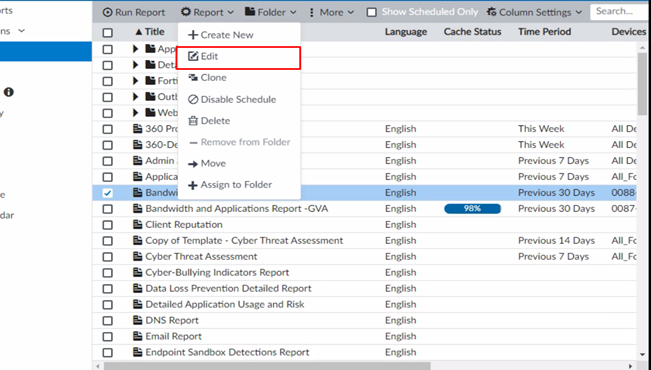
- After clicking on the edit, you will see generated reports, settings and editor.
- Generated reports: you will see the reports which is generated already.
- Editor: you can edit the layout of your reports as per the customers’ requirements.
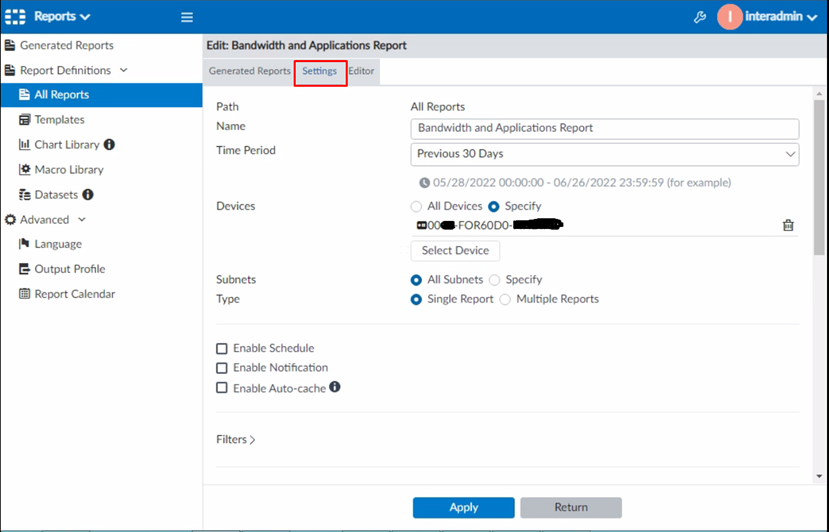
- Settings: under settings, you can see the below options.
Name – you can give custom names to the reports.
Time period – you can select the time range, here I am generating for the previous 30 days.
- Device: we have two options here.
1. All devices– this will generate a report for all firewall/devices which is connected to this Forti Analyzer or in your network.
2. Specify- from here we can select the individual devices as I have selected below.
- Subnets:
- All subnets- you can run reports for all subnets which is currently implemented in your FortiGate.
- Specify– for particular subnets (not for all the subnets).
- Type:
- Single report- for each device it will generate a single report.
- Multiple reports- for each device It will generate a separate report
Now you have three options here,
- Enable Schedule: from here you can schedule your report like when it needs to be generated automatically.
- Enable Notification: Select this to enable report notification when generated.
- Enable Auto-cache: When enabled, this process uses system resources and is recommended only for reports that require days to assemble datasets. Disable this option for unused reports and for reports that require little time to assemble datasets.
You can also apply filters and go to advanced settings to customize fonts, language layout headers and other features.
Once all this is done, click on apply and return to the Reports section.
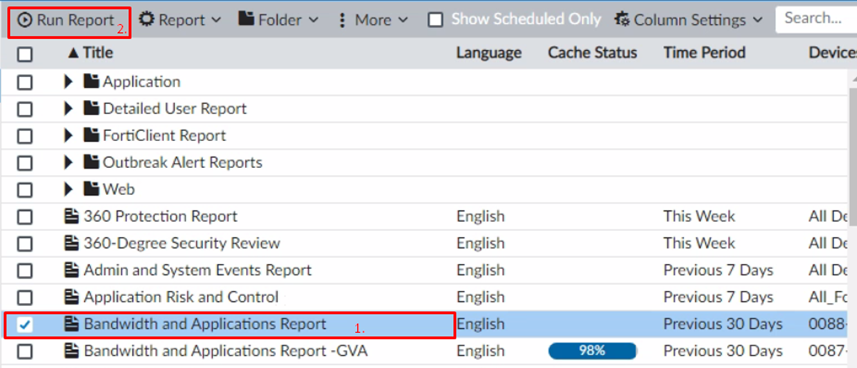
- Under the report section, select your template and click on run report.
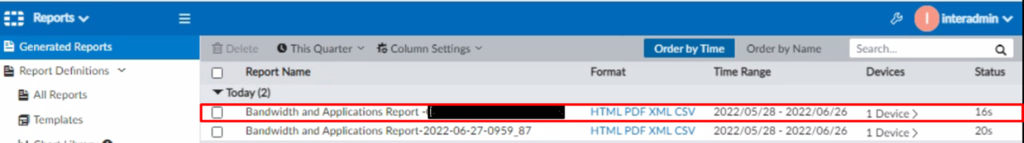
- After clicking on the Run report, you will be able to see your generated report in the Generated Report section below.
Here, you will see the report is generated, and you can download this in HTML, PDF, XML, or CSV format.
Upcoming
We upload blogs on our website on a weekly basis. Keep an eye out for it. If you want to go through all the other blogs that we’ve uploaded, you can visit our blog section.